Skip to content

SalienceYour work, as a living map.

Branches, PRs, tickets, CI, deploys — and the agents working on them — joined into one calm map on your second monitor. Local, private, yours.

The Salience map — the working set as file nodes with typed edges between them

Why Salience

On a recent contract I worked as a one-man scrum team, drowning in tabs and windows: IDEs, terminals, Teams, Jira, Bitbucket, TeamCity, Docker, AWS, Sentry. Some tabs existed to repeat the same actions — run the tests, SSH into an instance, run a migration. The rest existed to answer questions whose answers lived across several tools at once: Is my ticket in sync with my work? What's actually deployed right now?

Home Assistant showed me the fix. My car knows its fuel level, my calendar knows my next meeting, my house has smart lights — three silos. Home Assistant joins them: if the morning's meeting is further away than the remaining fuel will take me, the lights turn red. Information that already exists, brought to me instead of me going to find it — with enough time to act.

Salience does that for developer tools. It doesn't replace any of them — it replaces the tabs, and the questions with answers. A red light at just the right time.

The full story →

See it work

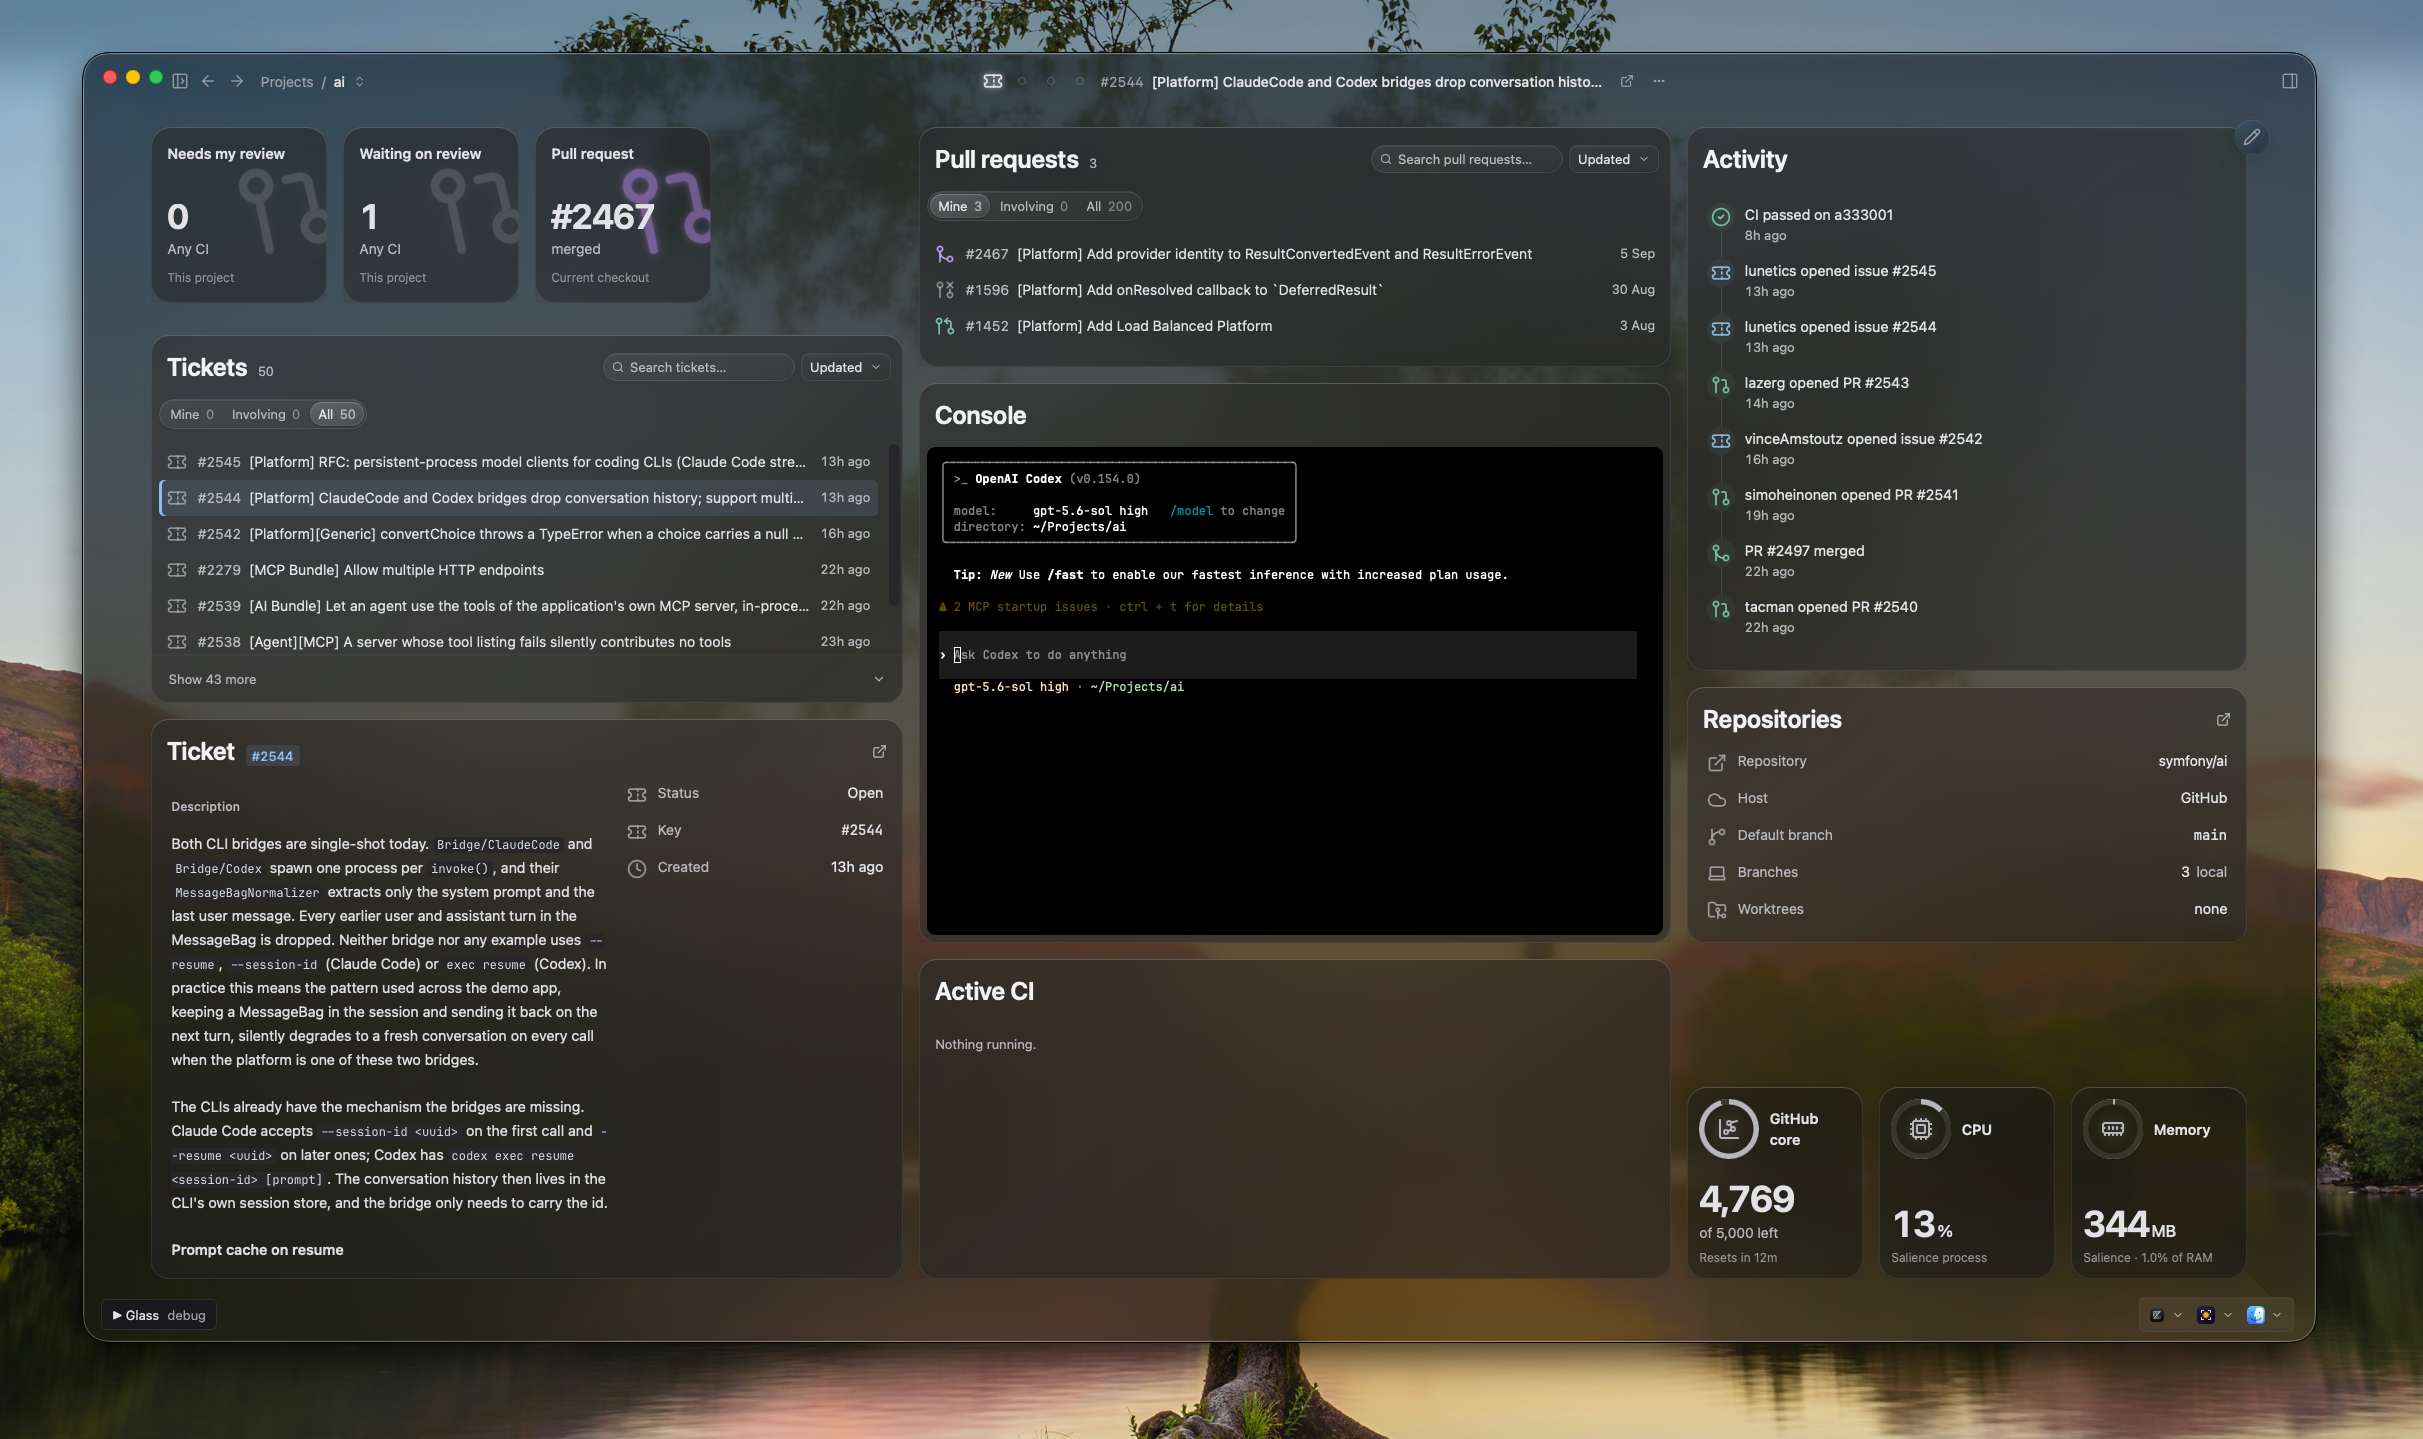
Home — every project, its checked-out branch, and what needs your attention

Home: the Needs Attention feed across all projects, above per-project cards with branch state

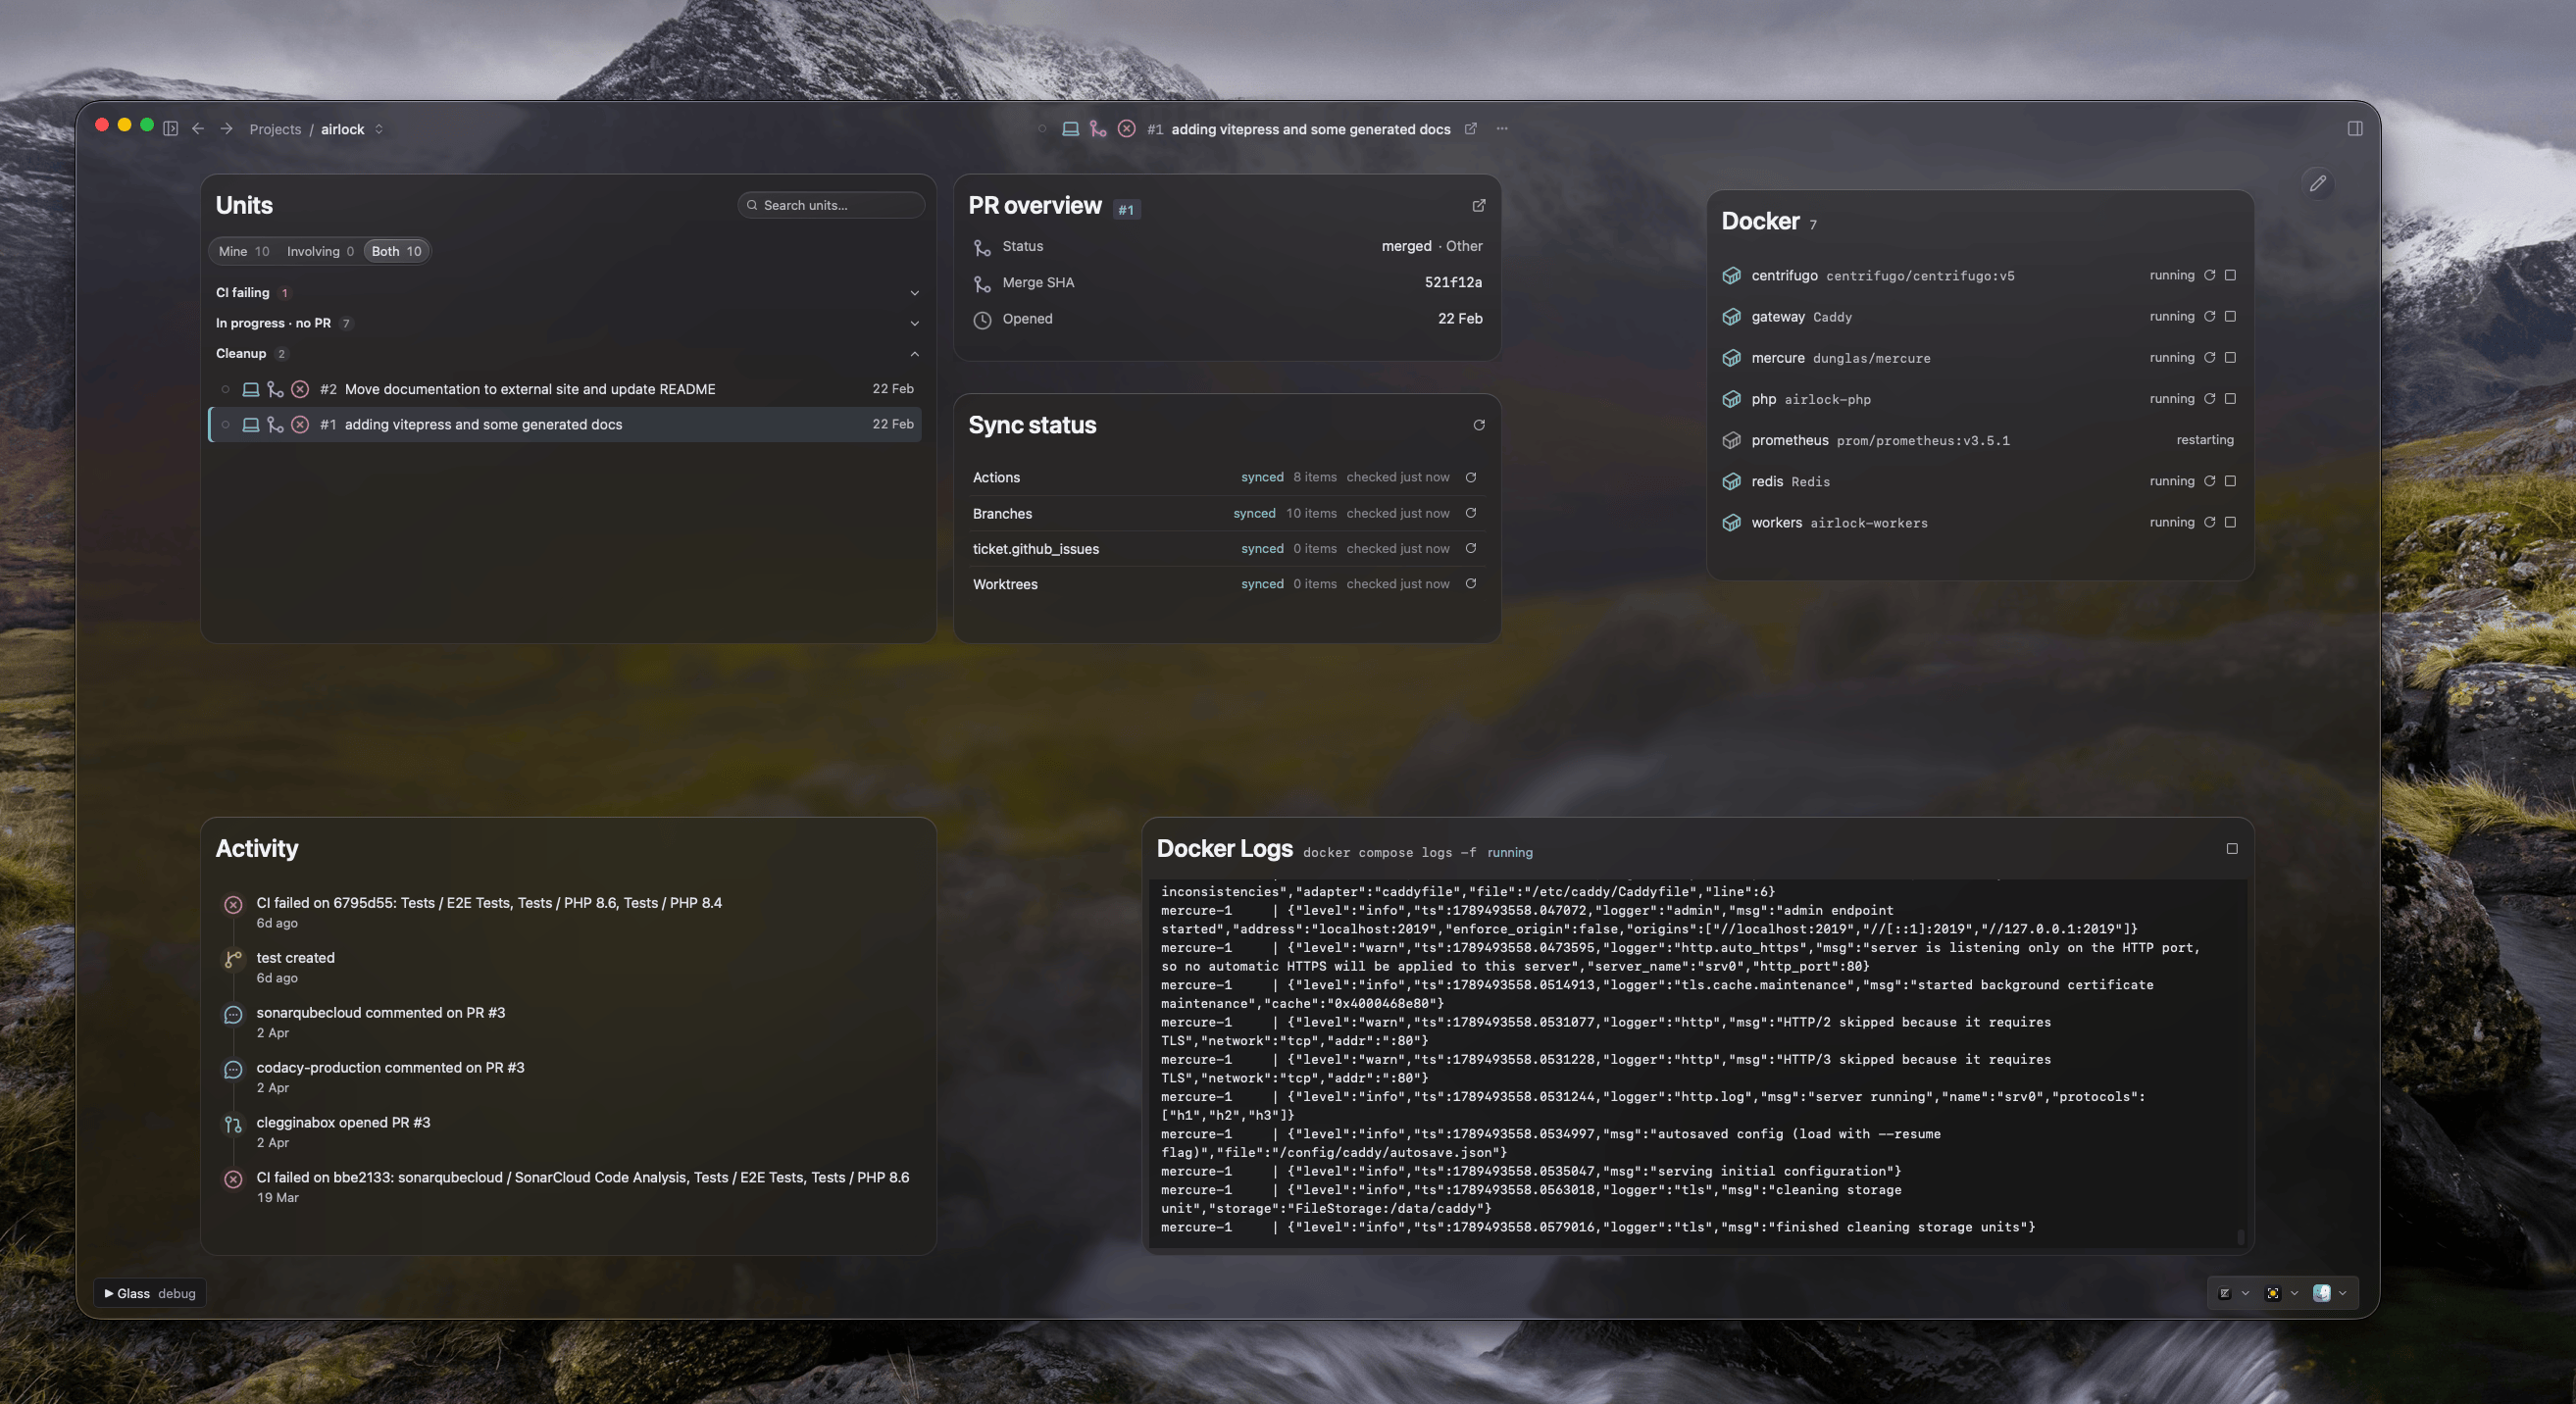
Your stack, on the map — compose services as buildings, lit by their running containers

Docker Compose services rendered as buildings on the map, with the compose.yaml diff open

Select a file, see its diff — without leaving the map

A selected file node with its diff in the map's detail panel

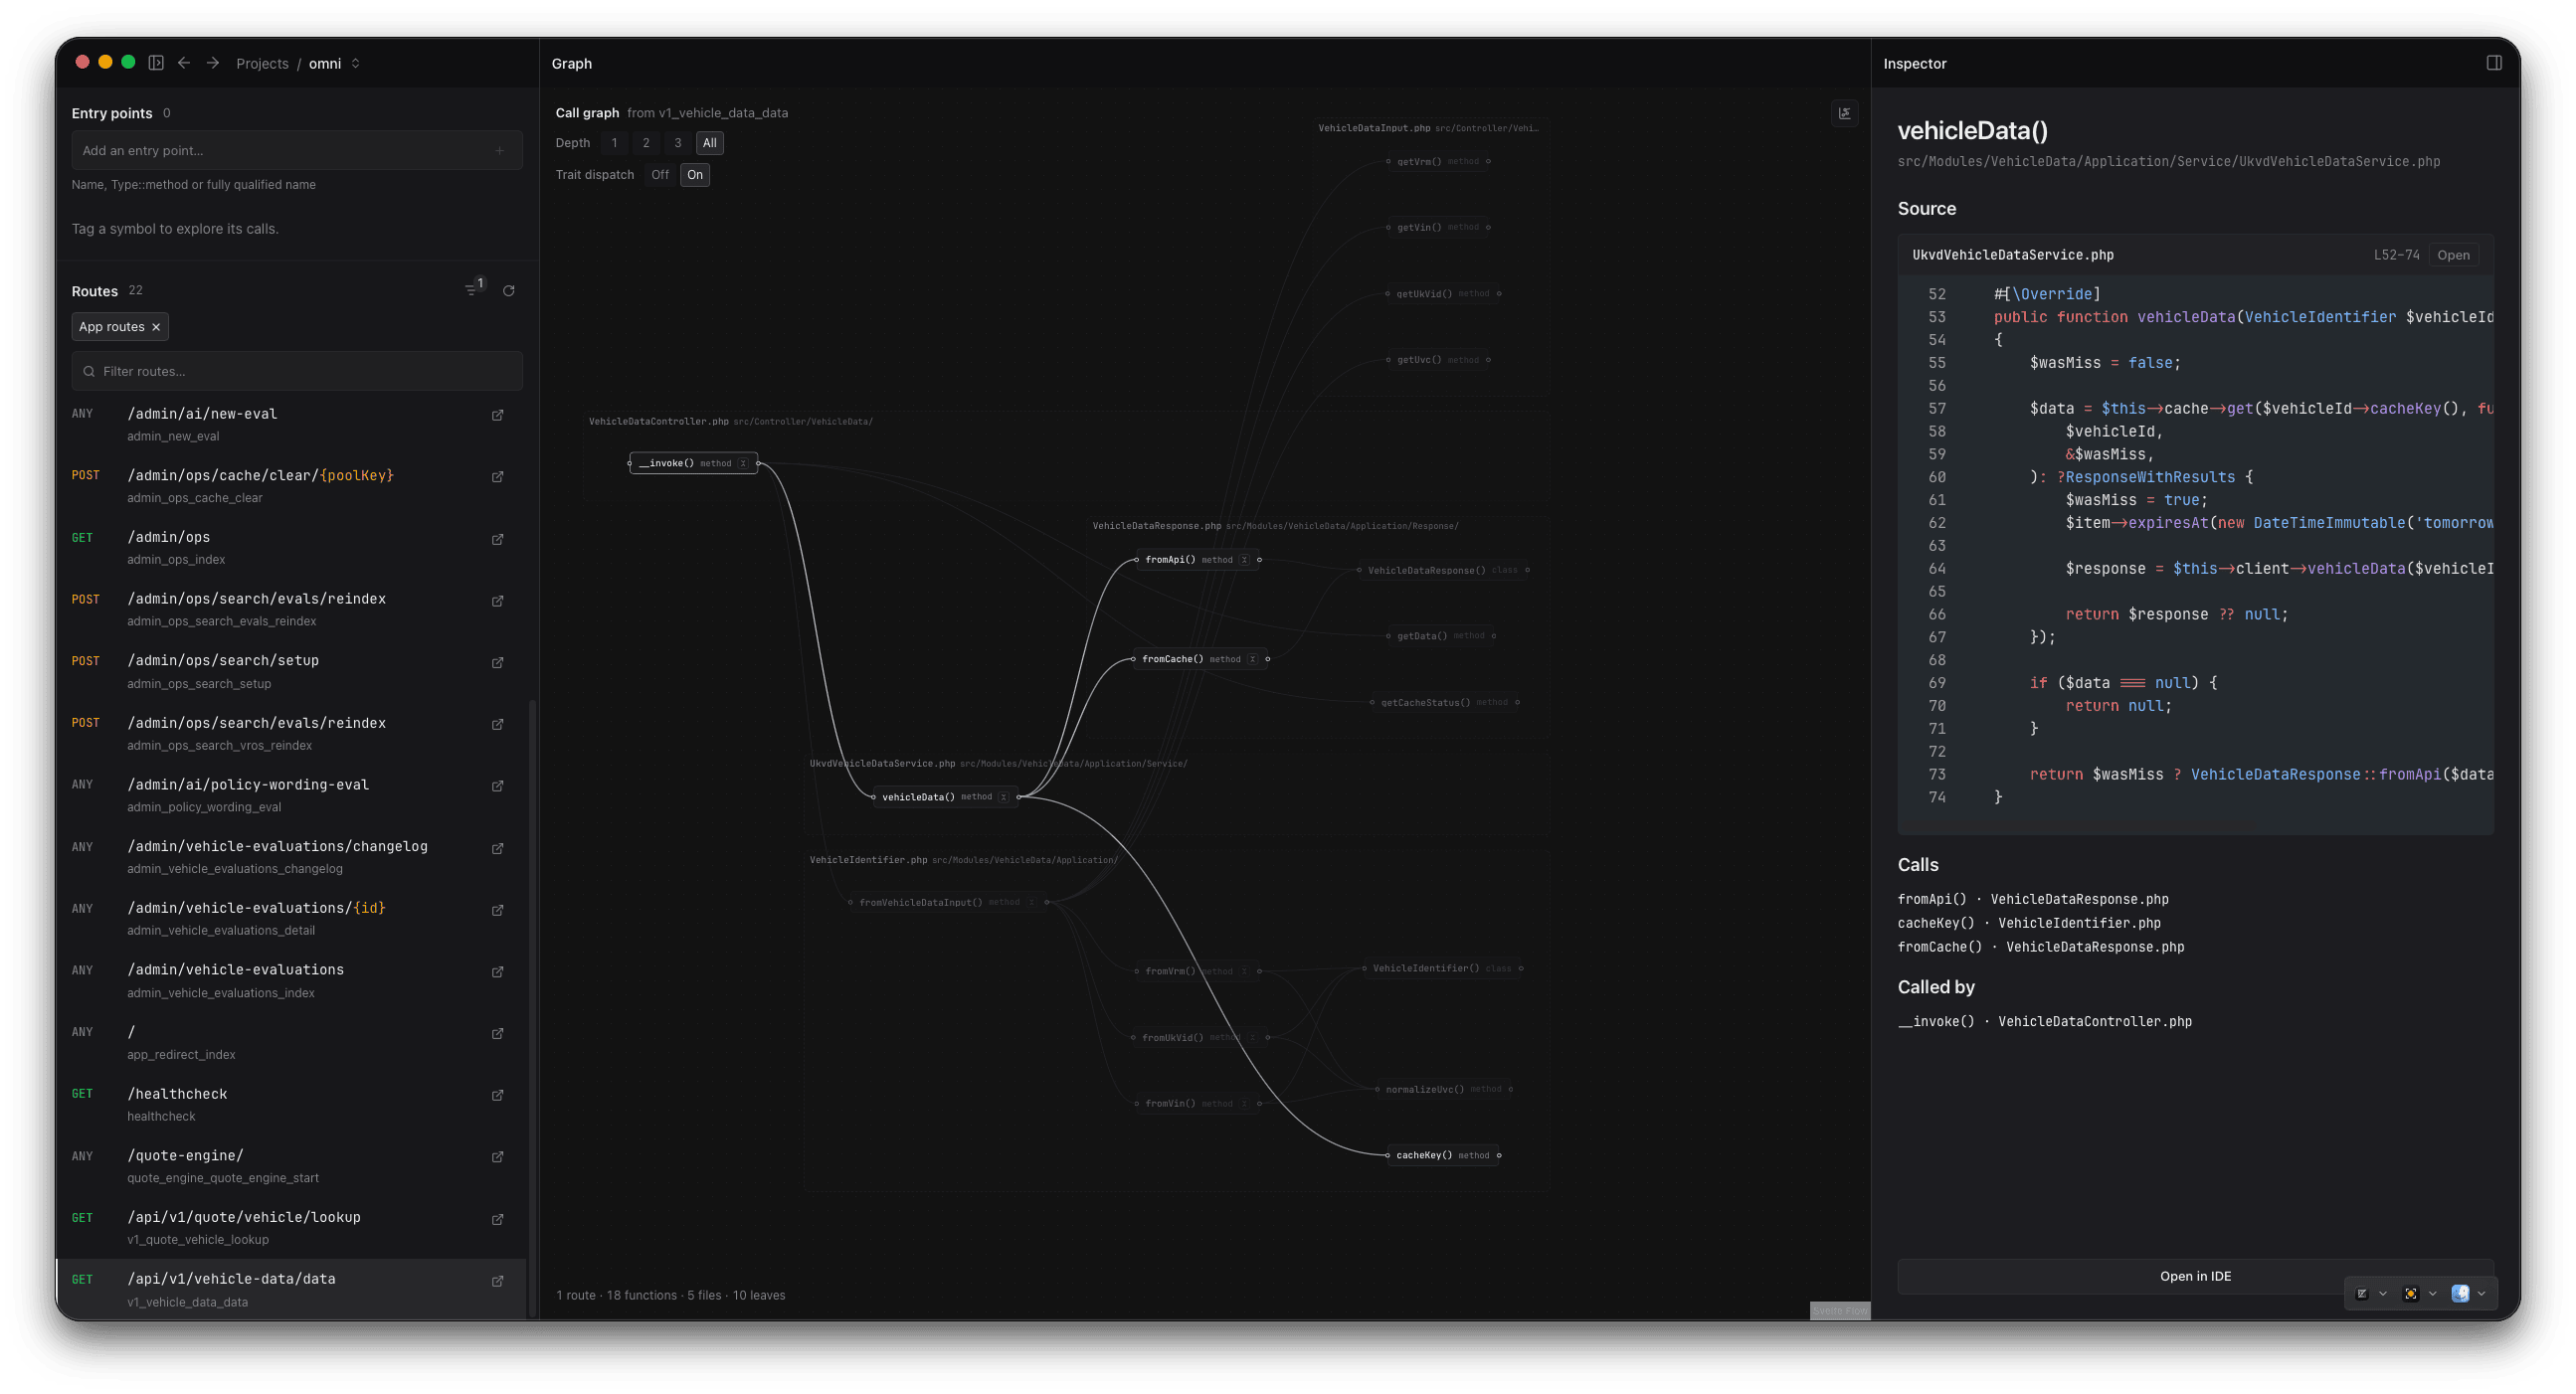
Code graph — pick a route, walk the calls, open anything in your IDE

A route walked through the call graph, with source and callers in the context panel

Worktrees — every agent checkout, triaged: what matters, what's just eating disk

The worktrees page with per-branch status phrases and disk sizes

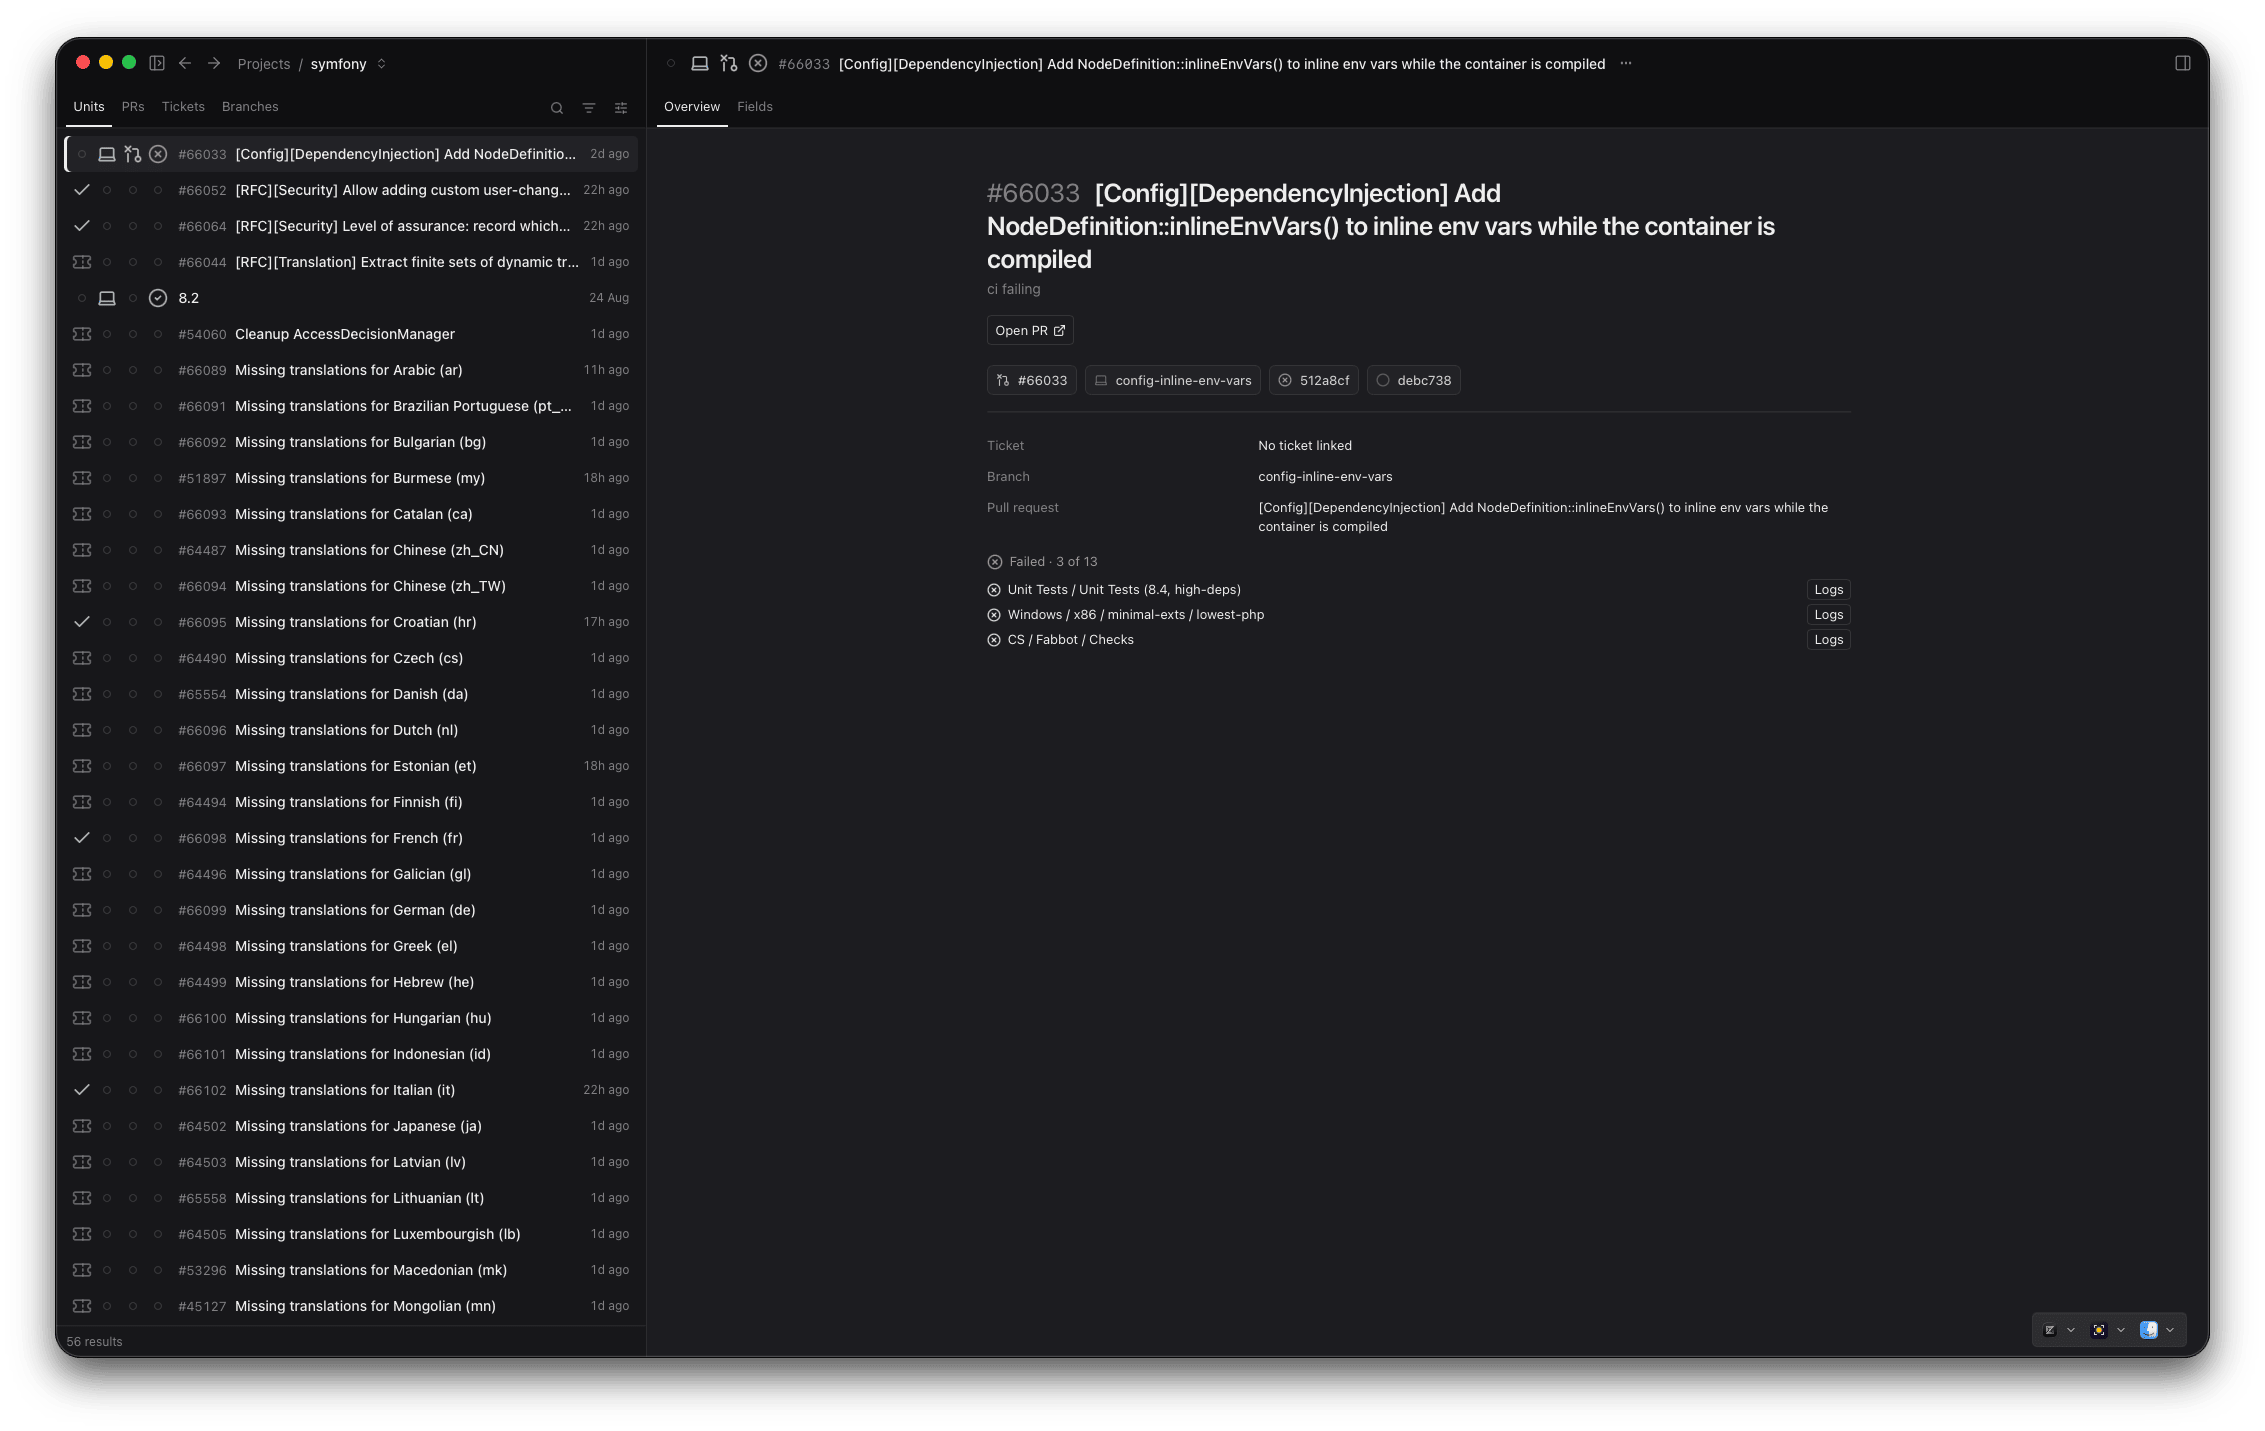
My Work — everything in flight, grouped by what's wrong, worst first

My Work: out-of-sync, stale, and in-progress sections with per-item chain state

Suggested — change a test file and "run this test" appears, with its last result

Suggested test and lint actions for the changed files, with pass/clean chips

Command palette — every action, every entity, one keystroke away

The command palette: actions, work, recipes, and map navigation in one list

Console — every run's result, its output, and a terminal, one keystroke away

The console pane over the map: run history, a phpcs report, and a terminal

How it works

Salience connects to your tools (git, GitHub, Bitbucket, Jira, Docker, AWS) and turns what it finds into entities — branches, PRs, tickets, CI runs, containers. Unlike a dashboard, these aren't fetched, shown once, and thrown away. Entities are typed, queryable and persisted as a correlated graph in an embedded database on your machine.

Every change streams out of the store as a live-query delta into a derivation engine. Correlators draw edges between entities from different sources — this branch implements that ticket, this container runs that image, this PR's commit is what's deployed. Rules then promote what the graph knows into situations"PR merged but the ticket is still open" — each with a loudness that decides how hard it tugs at your attention at the current moment in time.

The map is just a lens over that graph.

Agents read the same graph

Because the graph is the substrate, the same correlated context is open to your AI tools: Salience ships with an MCP server. Point your AI agent at it and ask in natural language: "What's my stand-up today?", "Can I unblock anyone?", "What work was on the last deployment?".

Read the docs → · View on GitHub →

Salience is a desktop app for developers.