Code Graph
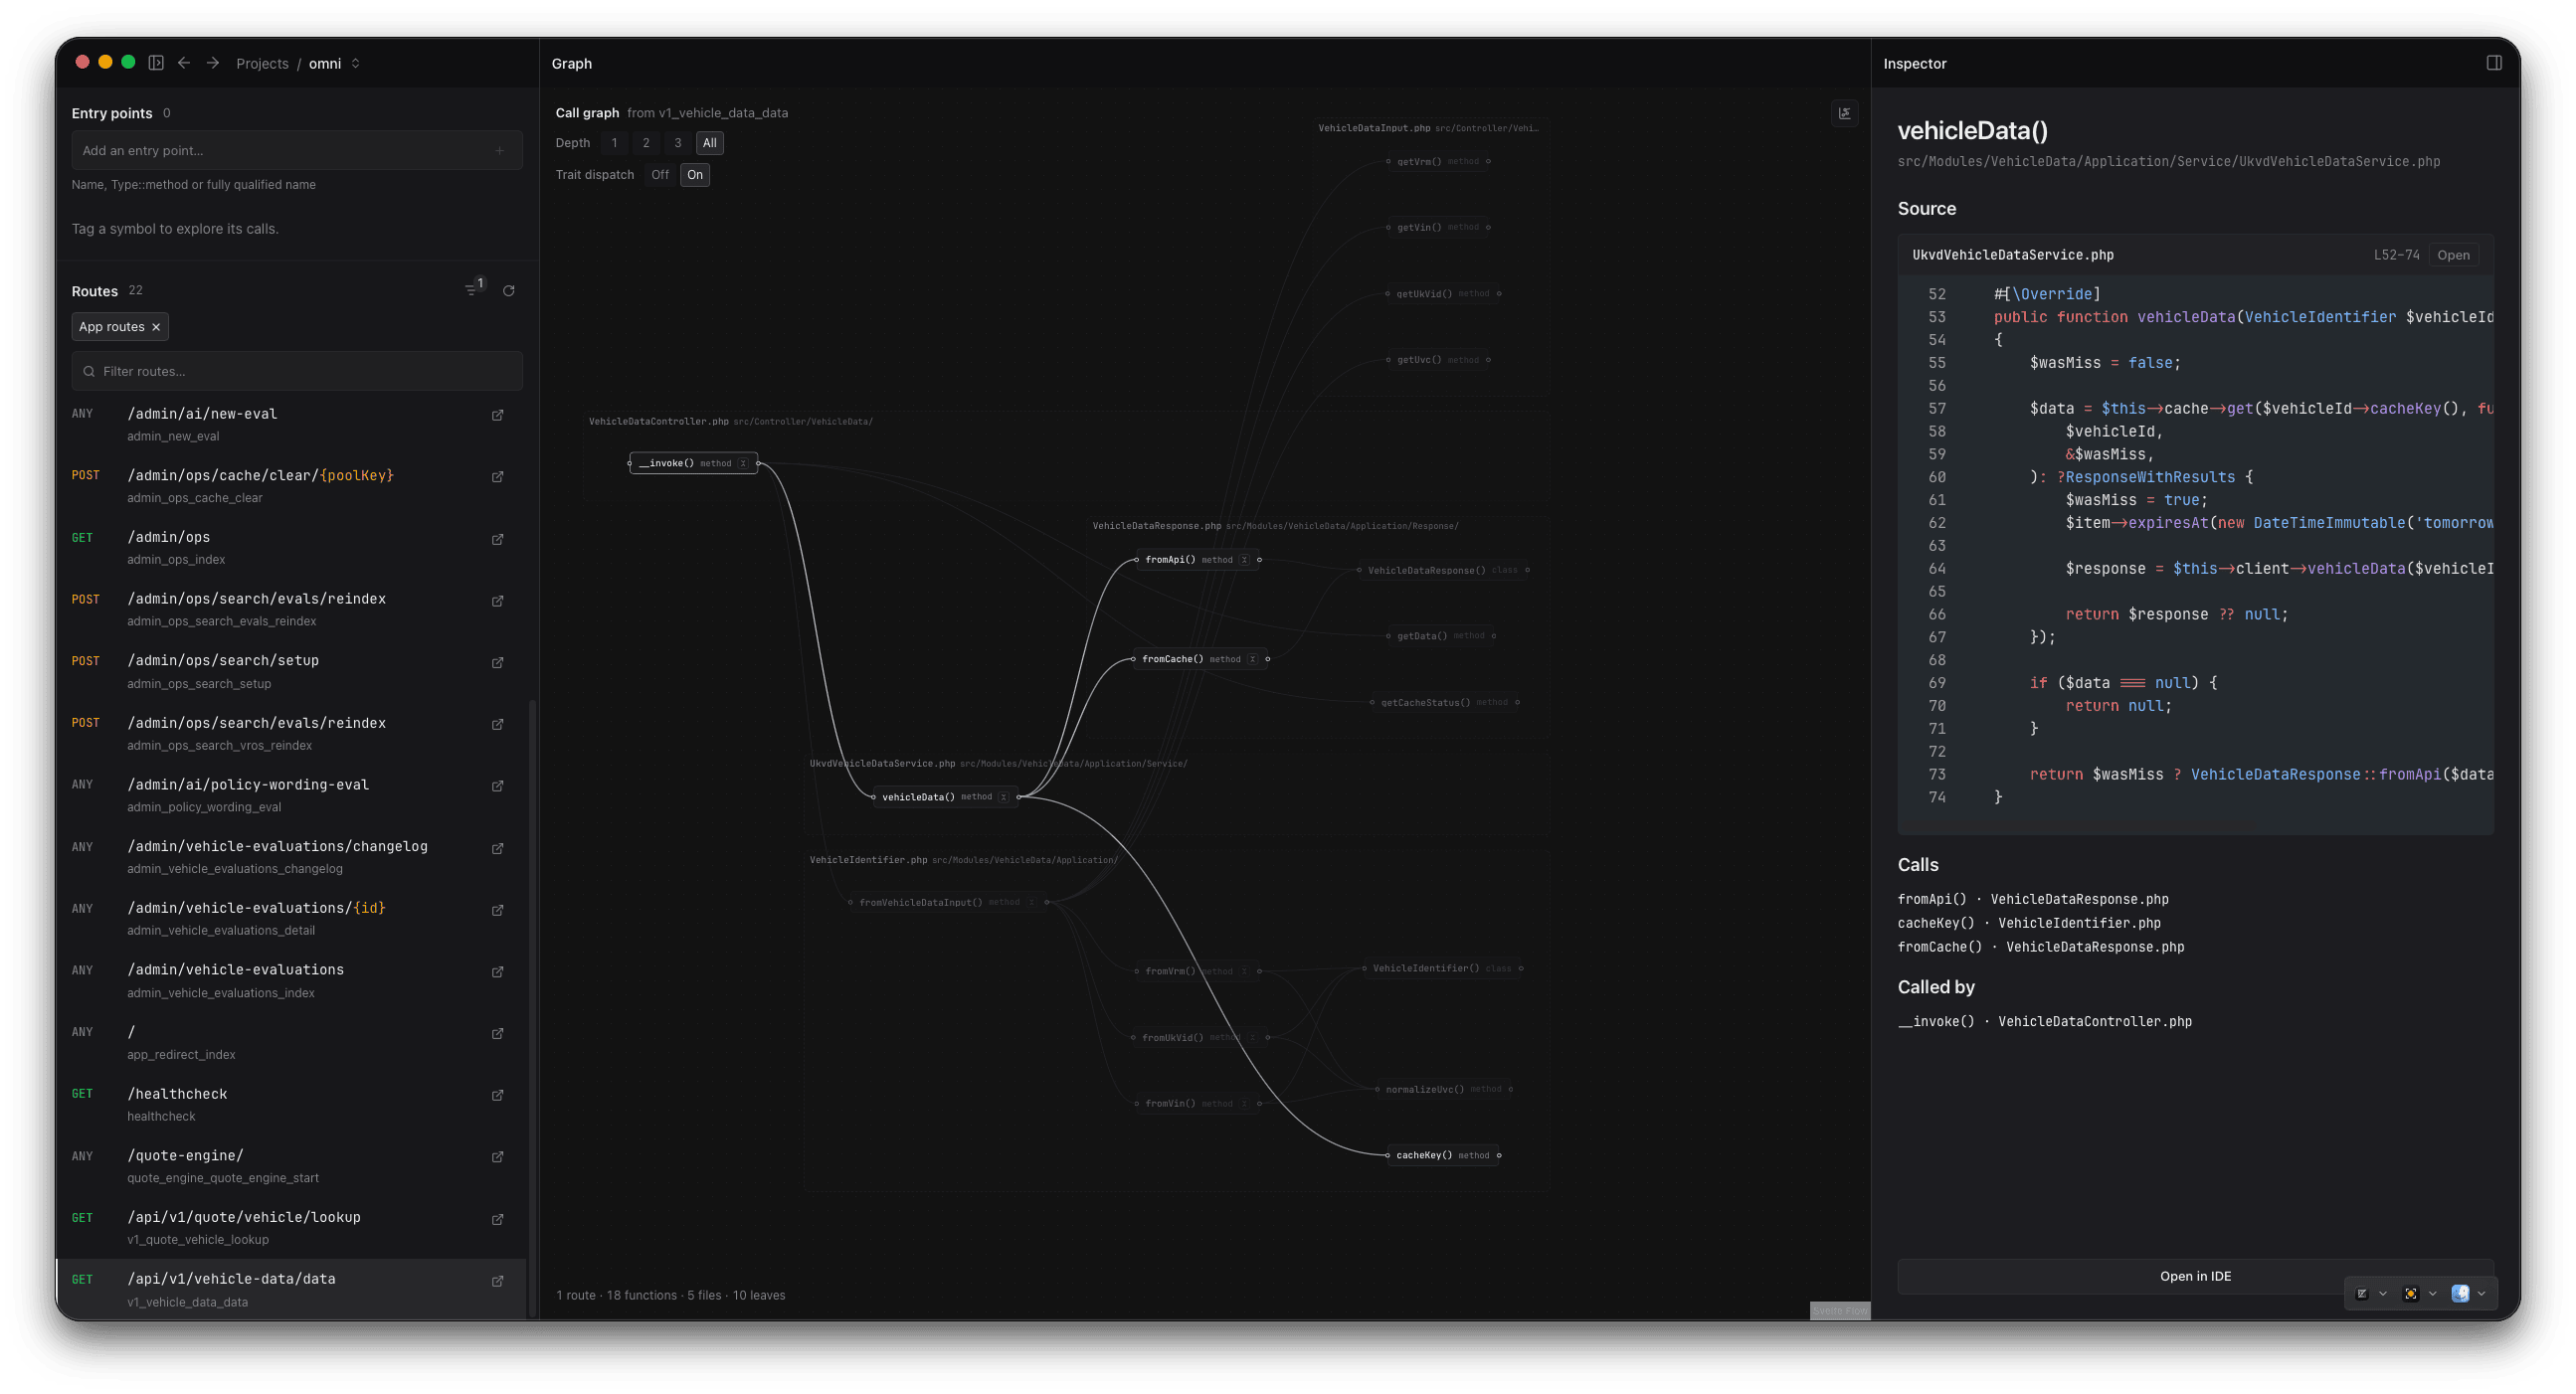
Salience indexes your project's symbols and the relationships between them, then lets you ask a question grep can't answer: what code does this HTTP route actually touch? Pick a route, and Salience walks the call graph outward from its controller and draws the files involved. It reads like your API docs — a filterable list of every route — except each row opens the actual call graph behind it. Nothing is installed in your project to make this happen: no package, no instrumentation, and you never have to run the app.
PHP is the only language indexed today. Everything on this page — the graph, the route walk, and the code-graph MCP tools — is PHP-only. The data model isn't PHP-specific, but nothing else populates it yet.
Find it under Code Graph in the project sidebar.
Prerequisites
| You need | Why |
|---|---|
| A PHP project added to Salience | The producer only scans PHP. |
A composer.json with an autoload block | Its PSR-4 / PSR-0 / classmap directories are the source roots that get scanned. Without one, Salience falls back to the conventional src and app. |
| For route sync: Symfony or Laravel | bin/console plus symfony/framework-bundle, or artisan plus laravel/framework. |
| For route sync: a resolvable PHP runtime | Either a local php binary or a Docker Compose service — Salience runs the command the same way it runs your test cues. |
vendor/ is never scanned. Third-party code shows up in the graph only as unresolved boundary nodes where your code touches it.
Building the graph
The parsing is powered by Mago, the Rust-based PHP toolchain: Salience uses it to build an AST of your codebase and derives the symbol graph from that.
The first ingest fires automatically, in the background, when you add a project — you don't have to do anything. It's not on a timer and there's no file watcher yet, so after that, re-ingest is a manual step: open Graph diagnostics and click Ingest now.
Re-ingest is incremental and cheap. Only files whose structure changed get re-parsed, and a pass where nothing changed skips the store write entirely. It's non-destructive and idempotent — running it twice does nothing the second time.
The graph stores symbols (classes, interfaces, traits, enums, functions, methods) and seven kinds of relation between them: calls, typehints, type_ref, implements, extends, uses, and overrides. Those are the same edge kinds the MCP tools query.
Syncing routes
Click Sync routes. Salience runs your framework's own route dump — bin/console debug:router --show-controllers --format=json for Symfony, artisan route:list --json for Laravel — and turns each row into a route entity: method, path, name, controller reference, and (when the controller is first-party) the resolved class, action method, file path, and code-graph node id.
The report line tells you what happened:
symfony · 214/318 first-party · 209 resolved · 4 removedfirst-party counts routes whose controller sits under one of your PSR-4 roots. resolved counts routes whose controller method was matched to a node in the code graph — only those can seed a walk. If neither framework is detected you get No Symfony or Laravel detected.
Routes are entities, so once synced they arrive live and persist across restarts. Re-sync after you add or rename routes.
Walking a route
The navigator on the left lists your routes with a filter box and two tabs — App (first-party controllers only) and All. Click a row and Salience runs a server-side breadth-first walk of the call graph starting at that route's controller method.
The walk follows calls edges and stops at the first-party wall: a call into a class outside your PSR-4 roots is not traversed. Calls landing on an interface method hop through to the concrete implementations rather than dead-ending on a bodyless declaration. Two caps bound the result — 400 methods visited, and 40 files in the rendered map. When the file cap trips, the map reports how many were dropped.
The result is rolled up to file granularity: one node per file, carrying only the methods the walk actually reached. Edges are file-to-file, labelled with the callee method name. The route's own controller file is marked as the seed. That rollup is the point — it's a map of the code paths this route depends on, not a call tree.
Inspecting a node
Click a node to open it in the inspector on the right:
- the walked methods in that file, each with a source snippet read live from disk
- CALLS and CALLED BY — the walk-local neighbours, sliced from the map already loaded, no extra query
- an Open in IDE action
⌘-click (or Ctrl-click) a node to skip the panel and open the file directly in your editor, positioned at the first walked method.
Graph diagnostics
The collapsed Graph diagnostics section at the top of the page is the dev-tools corner:
| PR file map | The file-granular graph of what changed on your branch versus its base, plus one hop of neighbours. Reports how many neighbours were hidden. |
| Last ingested | Timestamp and counters — files scanned, nodes, edges, unresolved, duration — for the most recent ingest. Read from the in-session event buffer, so after an app restart it reads Never ingested (this session) until you ingest again. |
| Nodes / Edges | Totals plus a breakdown by kind. Also summarised in the page header. |
| Ingest now | Runs an ingest and refreshes the stats. The report line includes the PHP version used and where it came from (runtime image, composer platform config, or composer's require floor). |
If a project has no graph at all, this section shows an empty state with the same button.
The same graph, for your agent
Everything on this page is queryable over the MCP server: find_definition, get_file_outline, find_references, find_callees, find_implementations, find_supertypes, and describe_symbol all read the same index. Those tools return locations and signatures, never source text — your agent opens the files itself.
See MCP server → Code graph for the full tool list.