Dashboard, Timeline & Explore
Three ways to look at the same entity store: Dashboard is a tile grid you compose yourself, Timeline is the project's live event stream, and Explore grows a correlation graph one click at a time.
Dashboard
A per-project stack of tiles. First run is deliberately blank — you build it.
- Edit mode — toggle it to add, remove, reorder, and reconfigure tiles.
- Add a tile — pick a type; if it has configuration, an inline picker opens before the tile is committed.
- Reorder — drag tiles while in edit mode.
- Reconfigure — reopen any tile's picker inline, below the tile.
The layout persists per project, locally (SQLite) — switching projects switches layouts.
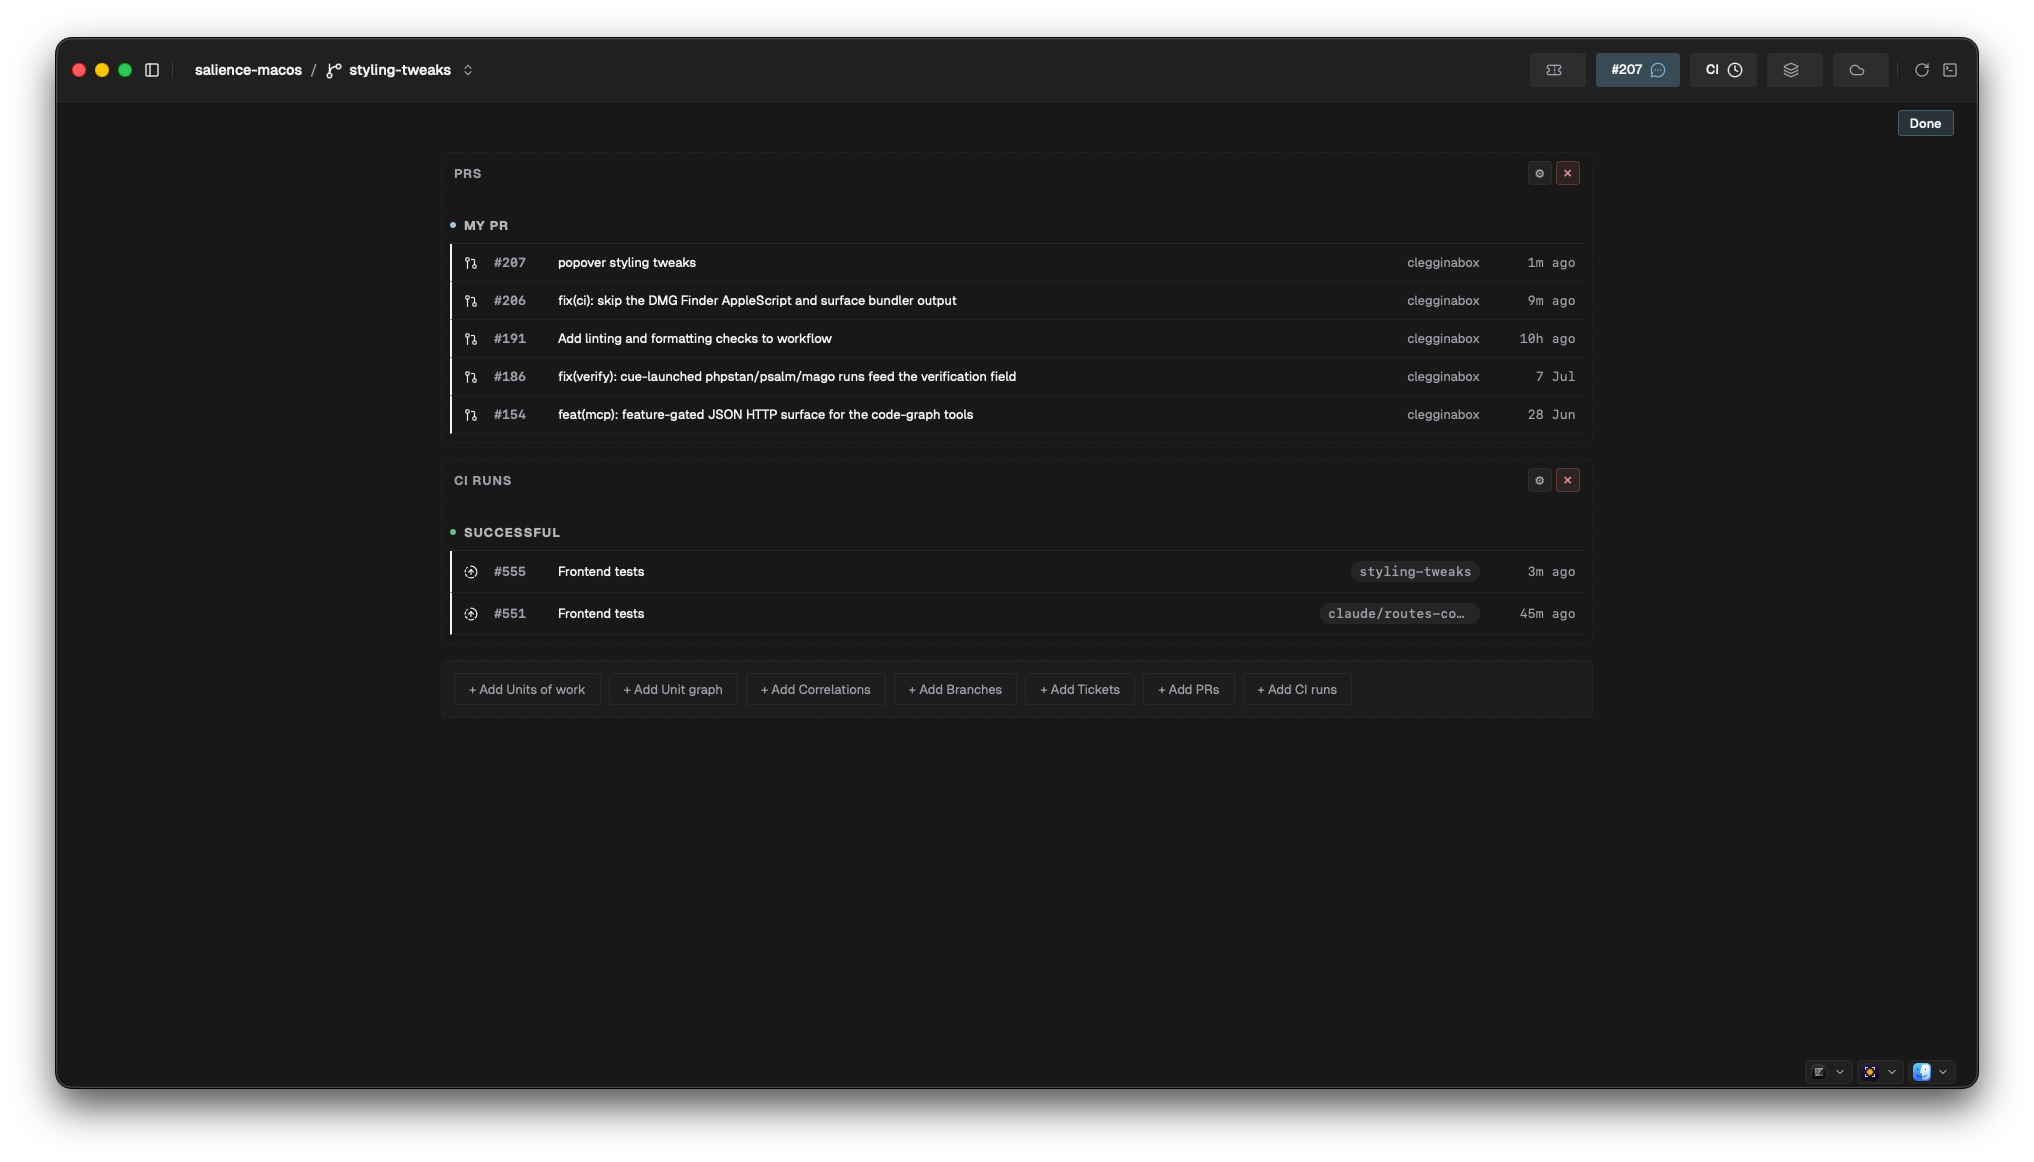
Tile types
| Tile | Shows | Configuration |
|---|---|---|
| Units of work | The same section-grouped unit list as My Work | None |
| Unit graph | One unit's ticket → branch → PR → CI → deploy graph | Pick the unit |
| Correlations | The correlation neighbourhood around a chosen entity | Root entity + walk depth |
| Branches | Local branches | Mode (recent / has PR / mine / stale / all), sort by latest commit or name |
| Tickets | Tickets, sectioned by your relationship to them | Relationships (mine / involving / team / none), optional status filter, sort |
| PRs | Pull requests, sectioned by involvement state | Involvement states (needs my review, needs my re-look, waiting on contributor, caught up, approved, my PR, watching), optional PR-state filter (open / draft / merged / closed), sort |
| CI runs | CI runs by pipeline state | States (failed, error, running, successful, …), sort by start time or pipeline name |
Timeline
The project's live stream — every domain event Salience records, newest first. Events bucket into Now (last 5 minutes), Today, Yesterday, and Earlier; bucket boundaries roll forward as the clock advances.
Filter by source with the chip bar — PRs, Jira, Issues, CI, Git, AWS — all active by default. Expanding a row walks the correlation graph around the event's entity; the Chain depth control in the header sets how many hops out that walk goes.
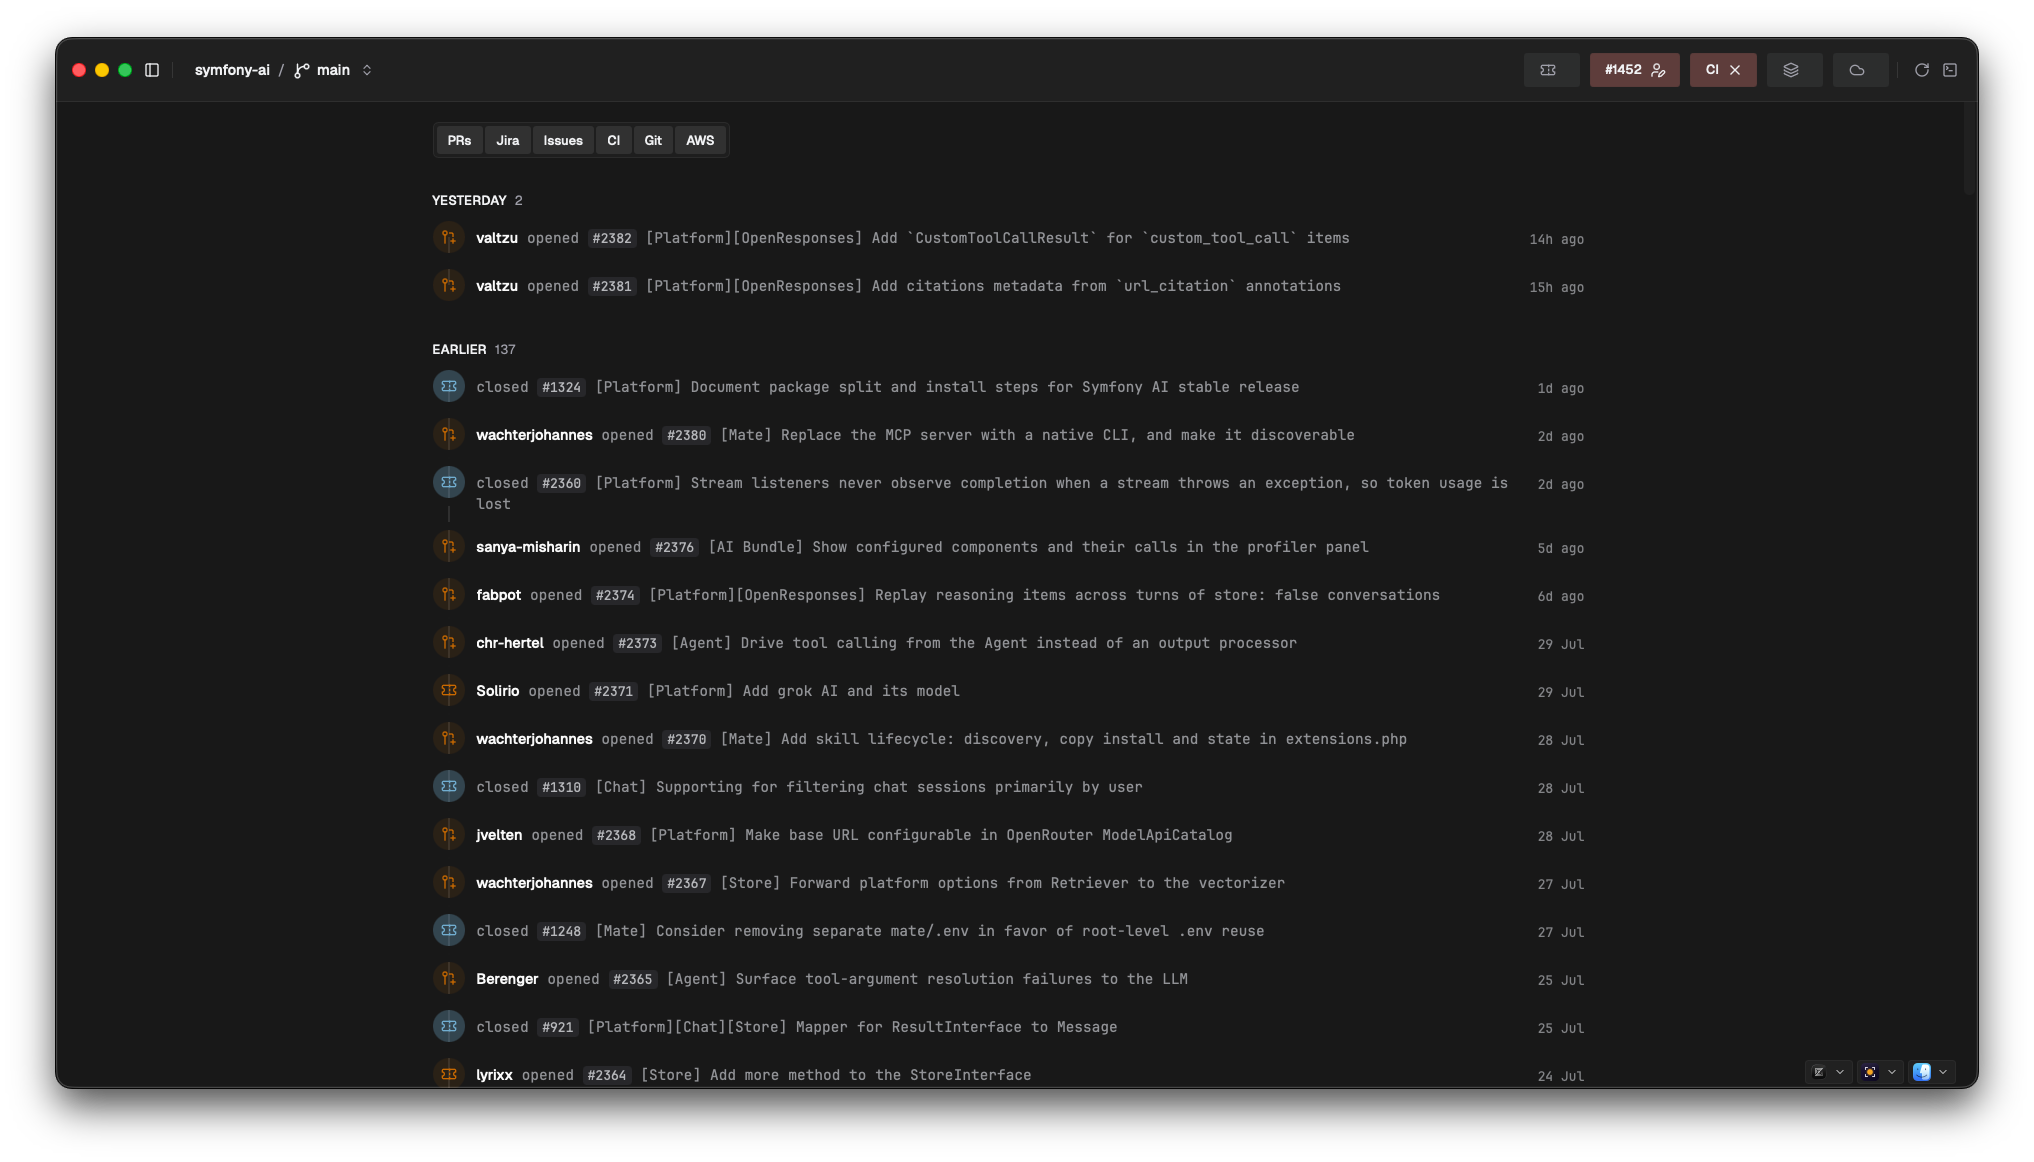
The stream is live — new events appear as syncs land, no refresh needed. Events only exist from the point you added the project and connected tools; Salience doesn't backfill history that happened before it was watching. See Connect your tools for what produces which events.
Explore
A grow-the-graph view for answering "what's connected to this?". It seeds with the project's local branches and nothing else. Click any node to pull in its immediate correlation neighbours — the PR for a branch, the ticket for a PR, and so on. Click again on a new node to keep growing.
There's no automatic walk: every hop is a deliberate click, so the graph only ever contains what you asked for. Reset clears back to the branch seeds.
Explore renders correlations that already exist in the store — it doesn't create them. If a click pulls in nothing, no correlator has linked that entity to anything yet; a branch with no PR, ticket, or CI attached is a legitimate dead end.